From idea to impact.

Test your words. Understand their impact.

Advanced simulations that predict how real people will react to your message. Share a headline, a statement, or a script and get reactions from synthetic people in minutes.

  • Real reactions in their own words
  • Scored on emotion + intent
  • simulate

    Synthetic people read your message.

  • analyze

    Reactions scored on emotion and intent.

  • predict

    See how each group will respond.

  • optimise

    Find the version that lands hardest.

  • trust

    Every answer traces back to its source.

See it in action

Same message. Four different people.
Four very different reactions.

Each synthetic person is built like a real one. They have a job, a city, local news they read, and online groups they follow. So they react the way real people would, not the way a generic audience would.

The message we tested

“New plant based protein bar. Only 3g sugar.”

1,000 people tested·17 different groups·finished in 8 minutes
M

Maya R.

35 · marketing manager · Brooklyn, NY

group

City parent · busy schedule · health conscious

backgroundReads NYC parenting forums and local news

‘Only 3g sugar' jumps out. That's the number I check at the bodega. But show me the protein first. That's what makes me actually buy a bar like this.
excited6.2
positive7.4
would buy6.8
for me8.1
C

Cal D.

54 · farmer · rural Iowa

group

Skeptical of marketing · wants real ingredients

backgroundReads farming forums and local Iowa news

‘Plant based' reads like a coastal pitch to me. Tell me what's actually in it. Soy, pea, what. Otherwise it sounds like a candy bar with extra steps.
excited3.4
positive4.2
would buy2.6
for me3.0
J

Jordan T.

28 · software engineer · Seattle

group

Reads ingredient labels · skeptical of buzzwords

backgroundFollows Seattle tech and food news

Sugar's fine. Ingredient quality matters more to me. If it's whole food protein, I'll grab one for the office. If it's just sweetener and isolate, hard pass.
excited5.1
positive6.0
would buy5.5
for me6.4
D

Devon K.

41 · HVAC technician · Atlanta suburbs

group

On the job · needs real food, not snacks

backgroundReads trade forums and Atlanta weather news

I burn 4,000 calories on a service day. 3g of sugar tells me it's not enough food. Show me the calorie count. Sugar isn't what I'm watching for.
excited4.8
positive5.2
would buy4.0
for me5.5

Same message. The Brooklyn mom looks at the sugar. The Iowa farmer wants to know what's in it. The Seattle engineer wants real ingredients. The Atlanta tech needs more calories. Your written summary catches all of this and tells you who to rewrite for next.

How it works

Three steps. About 10 minutes start to finish.

  1. 01Describe

    Tell us who you're talking to.

    Pick from a template, or describe your audience in plain English. Age range, where they live, what they do for work. Or just paste your creative brief and we'll figure it out.

  2. 02Run

    We build the audience and ask them.

    We create a balanced mix of synthetic people. Each one is shaped by where they live, their job, the local news in their area, and the online groups they follow. They all read your message and react.

  3. 03Read

    Get a clear summary you can share.

    Color coded scorecards show how each group reacted. You get the words that worked, real quotes, and a written summary of what to do next. Everything sourced and ready to share.

Real examples

Real messages, tested before they went out.

Three real examples. Two from political campaigns, one from a brand crisis. For each one, you'll see the actual message, what three different people said about it, and what the report recommended. Every test took under 15 minutes.

CASE 01Political campaign · closing line
800 people · 14 different groups

The line that won the base. And lost the suburbs.

A campaign tested its closing line on voters in four swing state cities before spending on TV ads. The audience had a balanced mix of Democrats, Republicans, and independents.

Closing line · version 1

“We're not asking for a handout. We're asking for a fair shot.”

Voters in 4 swing state cities · mixed political views

What 3 people said (out of 14 groups tested)

  • Wayne K.

    58 · pipefitter · rural Pennsylvania

    lands

    Republican · working class · small town

    That's the language. Nobody's giving us anything. We're earning it. Sounds like someone who's actually been on a job site.
    excited7.6
    positive7.8
    would act7.4
    for me8.2
  • Priya S.

    42 · school administrator · Atlanta suburbs

    splits

    Independent · college educated · suburban

    ‘Fair shot' is fine, but ‘not asking for a handout' sounds defensive. Like I should already disagree. I want to know what they'll actually do, not what they're not asking for.
    excited4.4
    positive4.6
    would act3.8
    for me5.0
  • Jordan A.

    31 · designer · Phoenix

    misses

    Democrat · young professional · city

    It reads like a 1990s campaign clip. I don't disagree with it. I just don't feel anything. Where's the vision?
    excited3.2
    positive4.8
    would act2.6
    for me3.4

The takeaway

Strong with the base. Weak in the suburbs. The summary flagged ‘not asking for a handout' as the phrase that turned suburban voters off, and suggested a more hopeful rewrite that keeps the working class voters who loved the original.

CASE 02Political messaging · two versions
1,000 people · 17 different groups

Same policy. Two ways to say it. Only one travels.

A clean energy plan was tested with two different opening lines across all 50 states. The fundraising team loved the bolder version. The actual data told a different story.

Version A: about jobs

“A clean energy plan that creates two million American jobs.”

Version B: about Big Oil

“A clean energy plan that finally takes on Big Oil.”

1,000 voters across all 50 states · split between the two versions

What 3 people said (out of 17 groups tested)

  • Cal D.

    54 · farmer · rural Iowa

    lands

    Republican · rural · skeptical of DC fights

    ‘Two million jobs' is something I can talk about with my brother-in-law. ‘Big Oil' just sounds like the same DC fight everyone's tired of. Show me the jobs number.
    excited6.8
    positive6.4
    would act6.6
    for me7.2
  • Rita C.

    47 · ops manager · suburban Detroit

    lands

    Independent · suburban · works in auto industry

    Version A I could email to my dad. Version B I'd skip. It feels like it's already decided I'm angry at someone.
    excited5.8
    positive6.2
    would act6.0
    for me7.6
  • Sam L.

    29 · climate organizer · Brooklyn

    splits

    Democrat · young · activist

    Honestly Version B reads better to me. It names the problem. But Version A is the one I'd want my parents in Ohio to see. They'd call B ‘too much.'
    excited7.2
    positive6.8
    would act5.4
    for me6.8

The takeaway

Version A won with every single group. About 1.8× more people said it would persuade them. Version B was loved by the political base but turned off the swing voters who decide elections. The summary recommended using A for TV ads, and B only for fundraising emails to existing supporters.

CASE 03Brand crisis · product recall
600 people · 9 different groups

The apology that brought customers back. And the one that didn't.

A consumer electronics brand wrote three different apology statements after a battery recall. Before publishing, they tested all three with their customers.

Apology · version 3 (the winner)

“We're recalling every unit sold since March. If you own one, we're refunding it in full and shipping the safer version free. Here's what we got wrong, and here's the fix.”

600 people: loyal customers, recently churned customers, and people considering buying

What 3 people said (out of 9 groups tested)

  • Nadia H.

    38 · loyal customer · suburban Boston

    lands

    Bought 3 times before · trusts the brand

    Okay. They said what went wrong, they're paying to fix it, and they gave a real timeline. That's the bar. I'd buy from them again.
    excited5.4
    positive7.6
    would act7.8
    for me7.2
  • Marcus B.

    44 · former customer · rural Tennessee

    lands

    Stopped buying last year · vocal on social media

    ‘Here's what we got wrong.' Finally. Most companies skip that part. I won't say I'm coming back, but I'd stop telling people not to buy them.
    excited6.0
    positive6.4
    would act5.0
    for me6.8
  • Elena R.

    26 · considering a purchase · Los Angeles

    lands

    New shopper · researching alternatives

    Refund, free upgrade, and they admitted what went wrong. That's actually handled well. I'd put them back on my shortlist. The other two versions sounded like a lawyer wrote them.
    excited4.8
    positive7.2
    would act6.4
    for me6.6

The takeaway

Three apologies tested in 12 minutes total. The version that admitted the mistake and offered a refund earned 2.4× more trust than the first draft. Even from former customers who were warning others not to buy. They published Version 3 the next morning.

Also tested with

  • Debate prep
  • TV ads
  • Local ballot measures
  • Fundraising emails
  • Hospital patient letters
  • Nonprofit donor appeals
  • Software launch headlines
  • Online product pages
  • Companywide memos
  • Crisis statements
  • Policy explainers
  • Press releases

What you get back

Not a guess. A clear, sourced report you can share.

A clear scorecard

See how your message scored on the things that matter. Does it grab attention. Does it feel positive. Would people actually act on it. Does it feel meant for them.

What it makes them feel

Joy, fear, surprise, anger. See exactly which emotions your message triggers, and where different groups feel differently about it.

Group by group view

One click and you can see who loves it, who's lukewarm, and who tunes out. Find the audience your message is quietly losing, before you spend the budget.

A written summary

The words that worked, real quotes from people, what to test next, and where every finding came from. Ready to share with your team or your client.

Validated twice. Two completely different domains.

Two independent studies. Both at 91% Population Match Score.

We didn't test once. We tested in two completely different ways. First a retrospective study against a personality inventory the model could have seen during training, the strict scientific benchmark. Then a prospective study against a political survey published after our model's training cutoff, a leakage-resistant test of true predictive power. Both landed at roughly 91% Population Match Score.

First, a quick primer · how the tool works

1

Build the people

We generate synthetic personas from public population distributions: U.S. Census demographics for age, region, education and income, plus published personality and value profiles. Each persona has a complete, internally consistent identity.

2

Ask them like real respondents

When you put a message, a poll, or a script in front of them, each persona reacts in their own voice, shaped by their personality, their life context, and the local culture they live in. The same persona stays consistent across every question.

3

Verify against reality

To make sure the personas actually behave like real humans, we run published surveys through them and compare the answer distributions to the real respondents. Below are two of those tests.

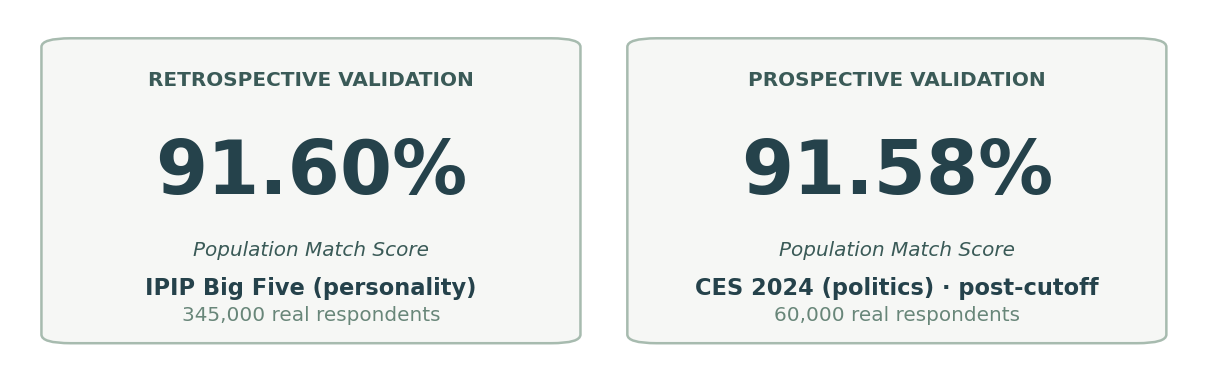
Headline · Population Match Score

Two tiles showing 91.60% Match Score for the retrospective IPIP Big Five study and 91.58% for the prospective CES 2024 study

Population Match Score = 100 × (1 − |synthetic mean − real mean| / scale range), averaged across items. A score of 100 means our synthetic personas' average answer is identical to real respondents'; 50 means our error is half the scale. We chose this metric over R² because it stays interpretable across rating scales (1-5 personality, 1-7 ideology, 0-100 thermometers) and answers a plain question: how close are we to real people, on the scale the researcher used?
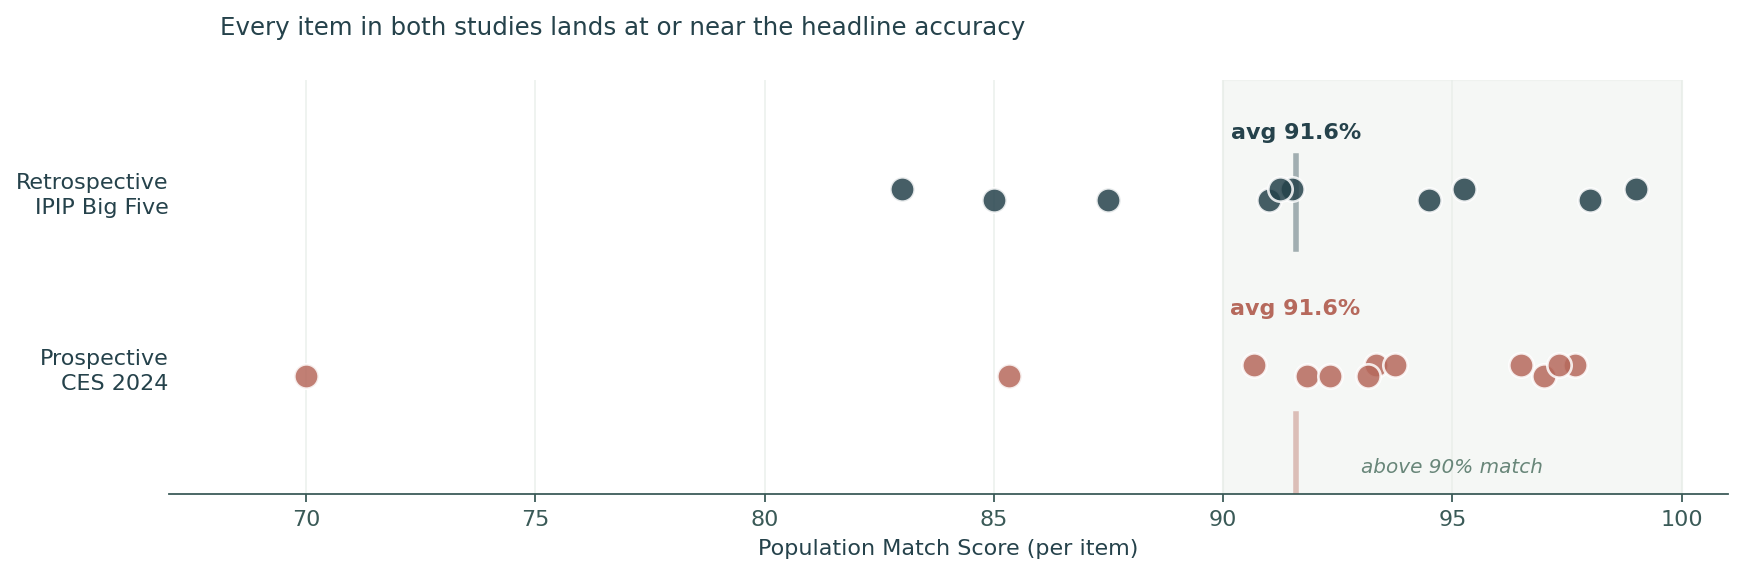
Per-item breakdown

Strip plot showing per-item Match Scores for both the retrospective IPIP and prospective CES studies, with most items above 90%

Every dot is one item. The shaded zone marks items above 90% match. The headline is not an average over wild swings. Both studies have their bulk of items clustered between 87% and 99% match, on the same scale, against completely different real-world populations.

Study 1 · RetrospectivePersonality · IPIP Big Five

Personality test, against 345,000 real respondents

The Big Five (OCEAN) is the most replicated personality instrument in psychology. We ran 500 synthetic personas through the standard 10-item version on a 1-to-5 agreement scale, then compared their distributions to 345,443 real Americans from the Open Psychometrics dataset. 91.60% Population Match Score. The synthetic mean lands within roughly a third of a scale point of the real mean on a typical item.

Honest caveat: this dataset has been on the public web since 2018 and was likely in our model's training data. It's the strict benchmark, not the leakage-resistant one. That's why we ran a second study (below).

Per Big Five trait

Average response per Big Five domain, synthetic vs real

Synthetic personas reproduce the real population's average score on every Big Five trait. Side-by-side bars show the synthetic mean (lighter) next to the real mean (darker) for each trait.

Study 2 · ProspectivePolitics · CES 2024 · post-cutoff

Then we ran a study our model has never seen

To rule out memorization, we ran the same kind of comparison against the Cooperative Election Study 2024 Common Content: 60,000 American adults, fielded by YouGov for Harvard, first released on Harvard Dataverse on April 3, 2025, after our model's training cutoff. Twelve numeric items (job approval, ideology ratings, self-rated ideology) were pre-registered before the run.

Result: 91.58% Population Match Score, within a tenth of a percentage point of the retrospective IPIP run, on data our model could not have memorized. Ten of twelve items within half a scale point; all twelve within one. When we split the personas by political party and check whether our Democrats look like real Democrats and our Republicans look like real Republicans, we get 88.35% within-cohort match. A model that had only memorized population averages would fail the within-cohort test by construction.

The receipt

Real vs synthetic per-item means, split by Democrat and Republican personas

Each dot is one CES item. Left: Democrat personas predicting the Democrat real mean. Right: Republicans predicting Republicans. Both panels hug the diagonal. Our personas reproduce the partisan structure of the response, not just the population average. CES Common Content DOI: 10.7910/DVN/X11EP6 · first released 2025-04-03 · model cutoff: Q1 2025.

What this does and doesn't prove: the personas reproduce the central tendency of real Republican and real Democrat ratings on items the model couldn't have memorized. Distribution shape (variance on bimodal partisan items) is still narrower than the real distribution. We surface this as the next open problem rather than hide it.

What this means

Two independent validations on completely different real-world populations both land at roughly 91% Population Match Score. One study the model could have memorized. One it couldn't. Both measurements landed in the same band. That's evidence our personas model people, not memorized distributions.

For the technically minded: the literal scores are 91.60% and 91.58%, within the sampling noise of either study at this size. The magnitude is the signal, not the third digit.

Synthetic people are a strong first signal. Pair with real-world research for high-stakes decisions. Methodology and per-item gaps are surfaced openly above. A copy of the validation report is available on request.

Stop guessing. Start testing.

Sign in and run your first test. Free trial. No credit card. No surprise bills.

Helpful as a first signal. Pair with real research for big decisions.